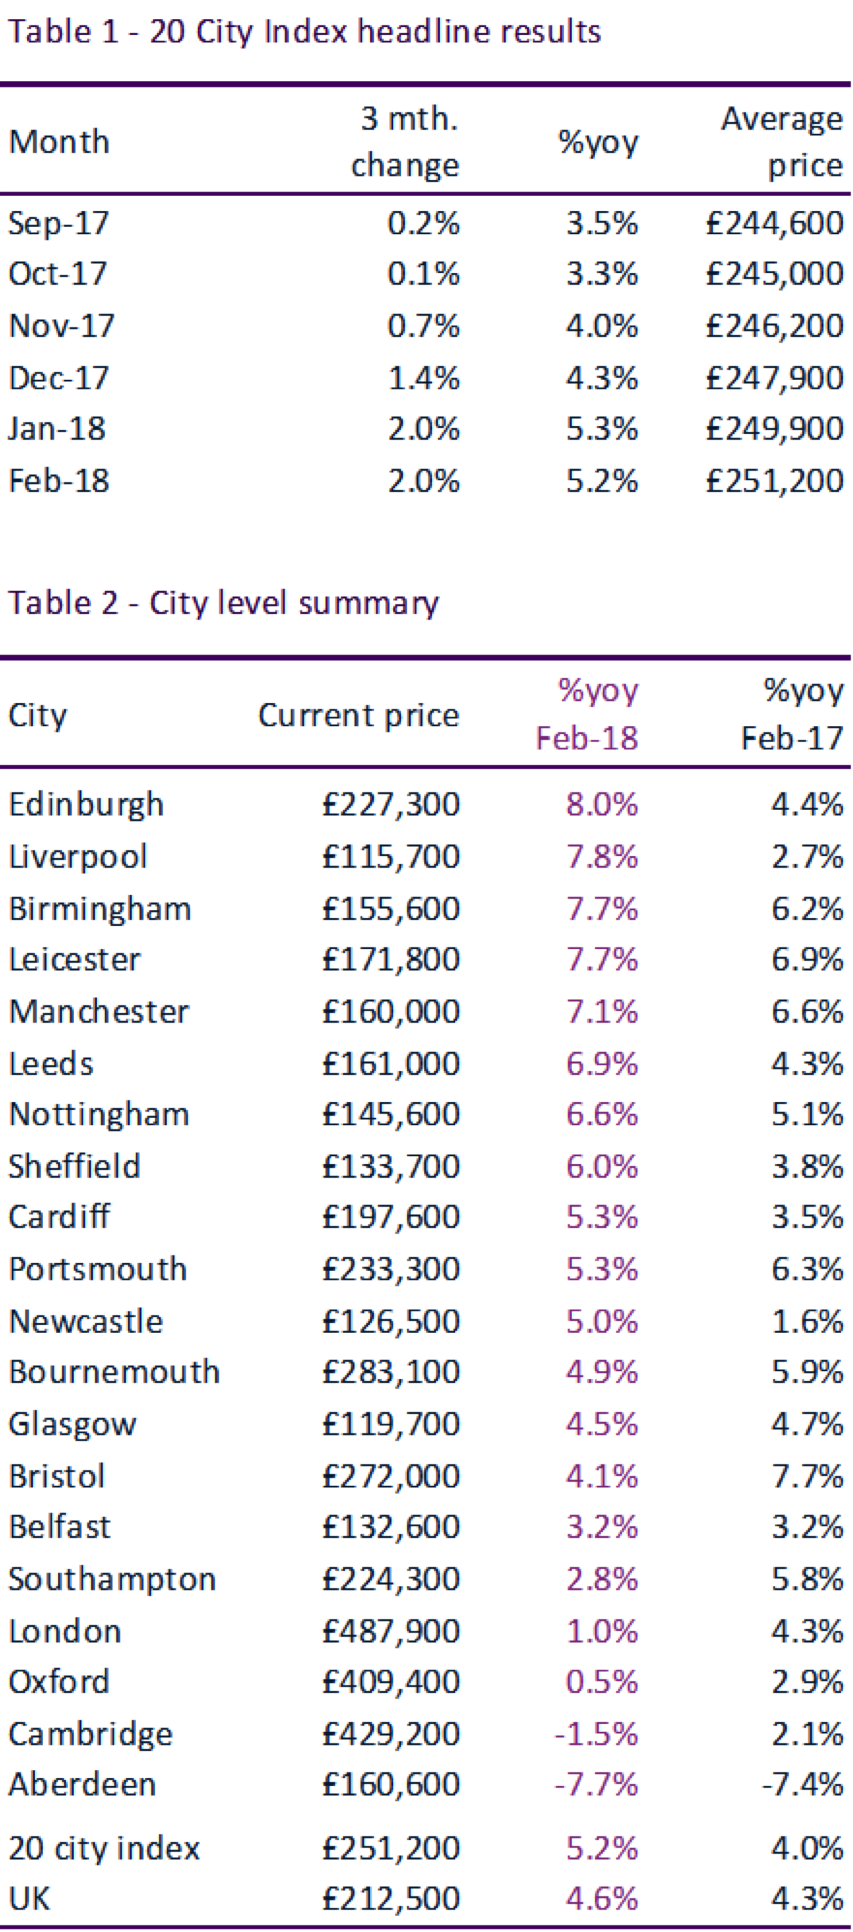
- UK city house price inflation running at 5.2%.
- London house price growth is 1% per annum with negative growth in 42% of postcodes. The coverage of markets with negative growth is rising as weak demand translates into price falls.
- Regional cities continue to register above average growth with five cities registering price inflation over 7% – Edinburgh, Liverpool, Leicester, Birmingham and Manchester.
The divergence in house price growth between southern England and regional cities continues with overall HPI at 5.2%. London growth remains slow at +1%, and the greatest downward pressure on prices is being registered in inner London.
City house price growth running at 5.2%
UK city house price inflation was 5.2% in the 12 months to February 2018 compared to 4.0% a year ago. The divergence in house price growth between southern England and regional cities continues.
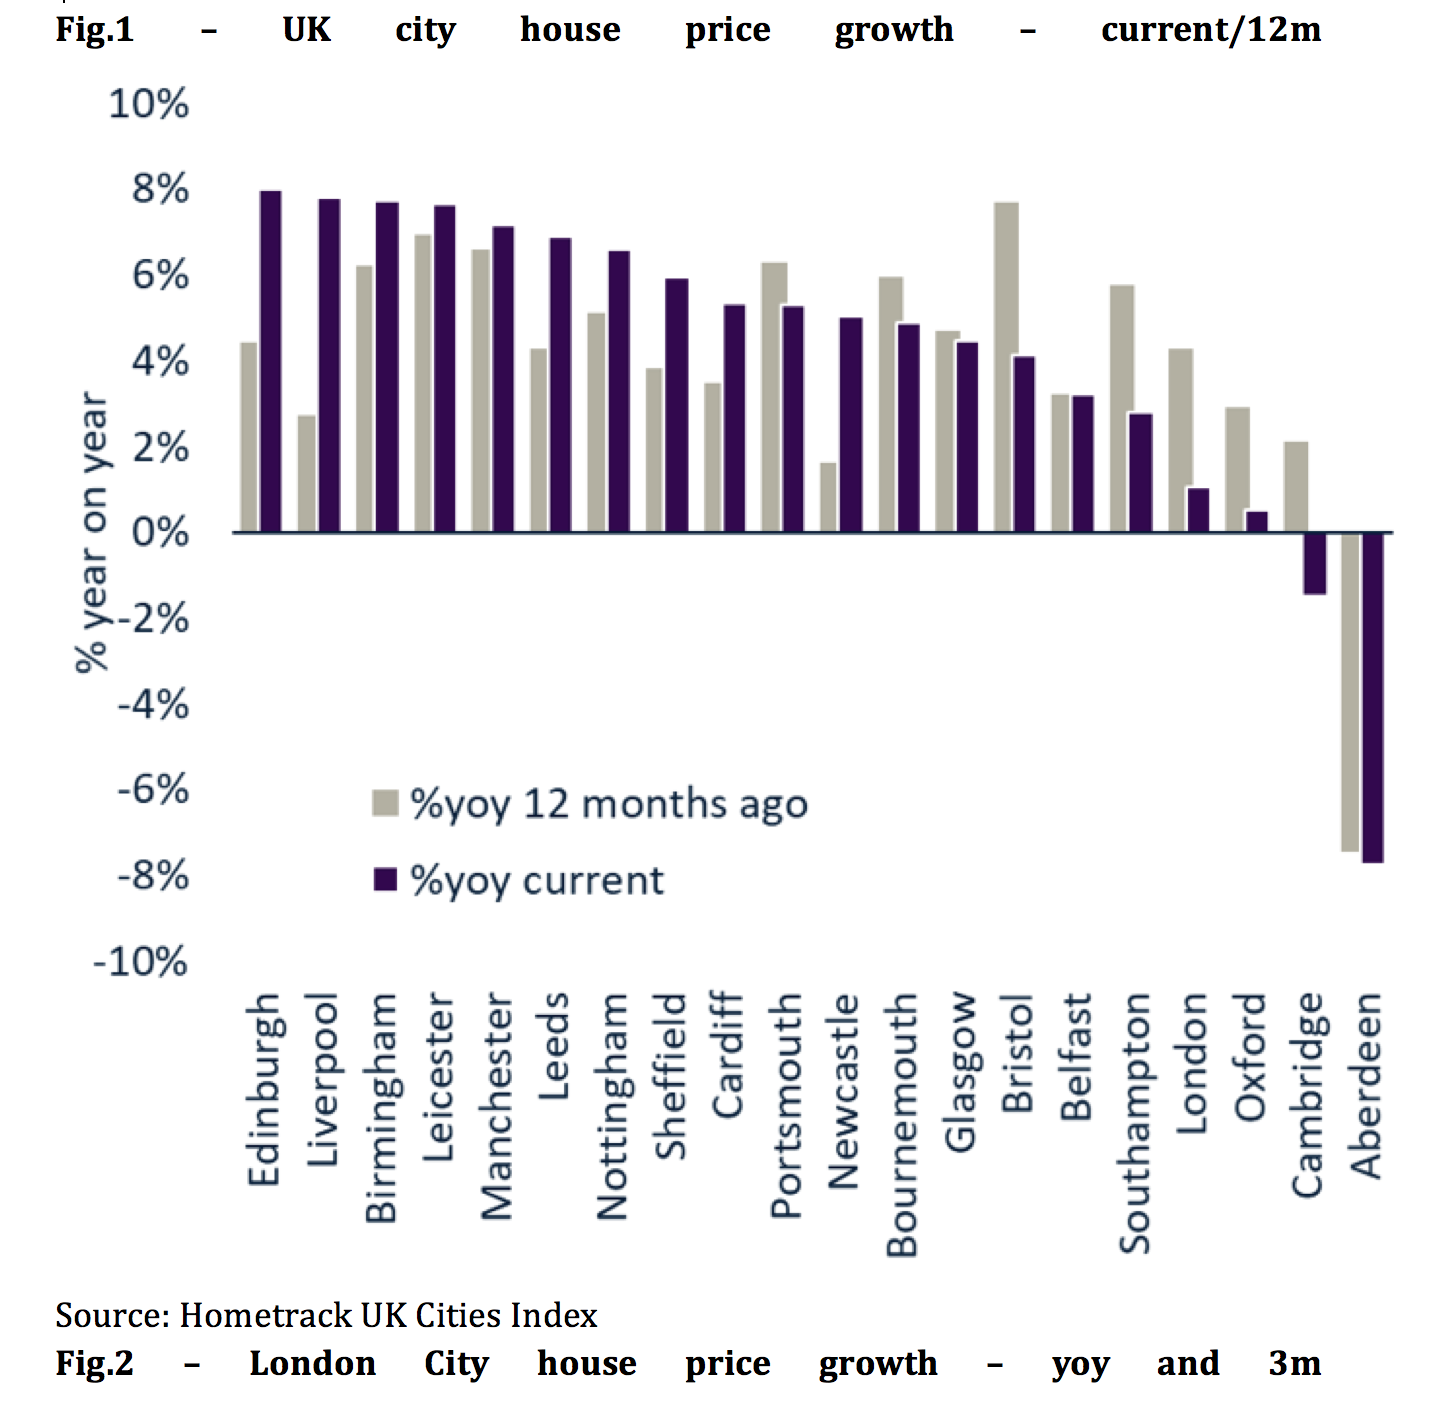
Half of the 20 cities covered by the index are registering higher annual growth than a year ago (Fig.1). Five cities are registering growth of more than 7% per annum: Edinburgh, Liverpool, Leicester, Birmingham and Manchester.
Ten cities are growing at a slower rate than a year ago with the greatest slowdown in Bristol, Southampton and London as affordability pressures impact market activity and the upward pressure on house prices.
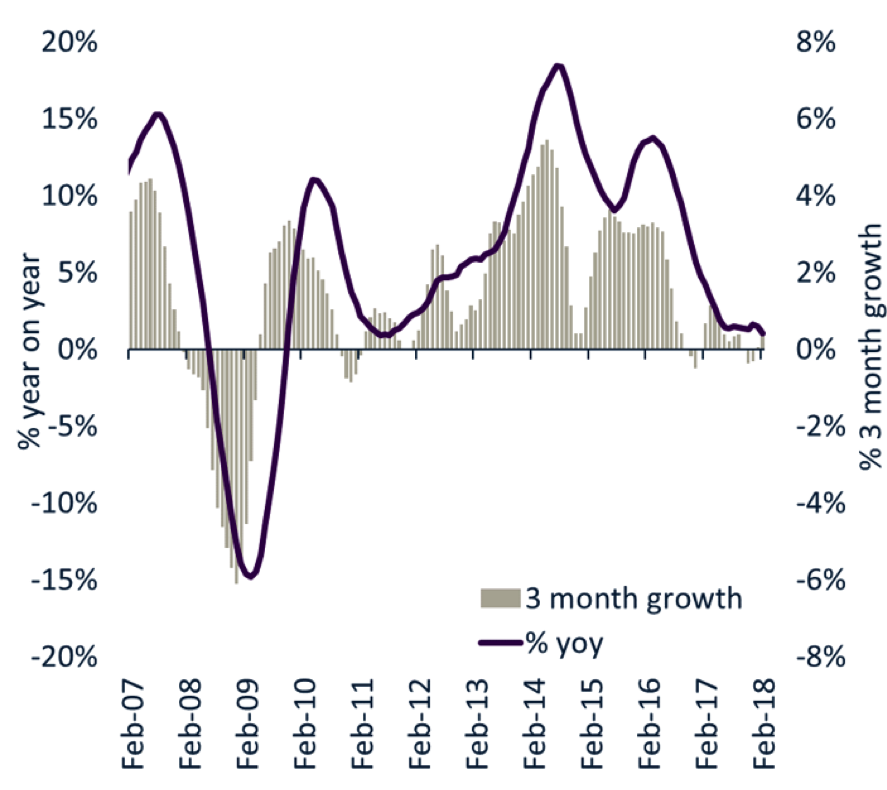
Annual London growth rate slows to +1%
The headline rate of growth across London has slowed to just 1%, down from 4.3% a year ago. This is the lowest annual rate of growth since August 2011. Over the last 3 months average prices have increased by just 0.4%, well down on 5% growth recorded per quarter recorded in 2014 (Fig.2).
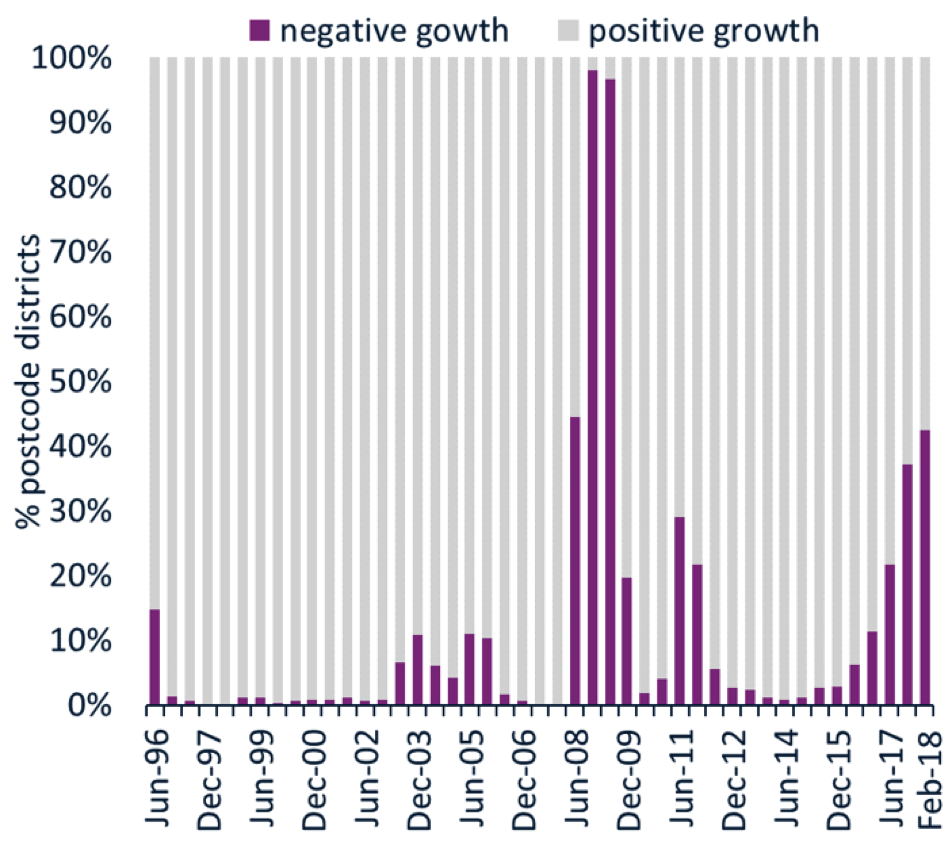
Prices falling across 42% of London postcodes
House price indices report the trend in prices for the average property while the reality is there is a distribution of growth around this average. Using Hometrack’s more granular house price indices at postcode district level (e.g. SE5) we find that 42% of postcodes are registering year on year price falls. The remaining 58% are still registering positive growth.
Source: Hometrack House Price Indices
Source: Hometrack House Price Indices
The highest coverage of price falls since 2008
Fig. 3 shows the proportion of London city postcodes registering positive and negative growth since 1996. The current coverage of markets registering negative growth is the highest since the global financial crisis. There have been other periods when parts of London have registered falling prices and these are explained by economic and other external factors.
Growth in falling markets a drag on headline rate
The coverage of postcodes with negative growth has risen sharply since 2015. This is a result of tax changes impacting overseas and domestic investors and stretched affordability levels for owner occupiers that have been compounded by Brexit uncertainty. Sales volumes are first to be hit when demand weakens and housing turnover across London is down 17% since 2014. Prices are next to follow but the scale of current price falls remains modest. Most markets registering negative growth are experiencing annual price falls of between 0% and -5%.
Coverage of price falls set to expand over 2018
We expect the number of markets with falling house prices to grow further in the coming months as buyers accept lower prices to achieve sales. The net result will be a negative rate of headline price growth for London by the middle of 2018.
Inner London the focal point for lower prices
The greatest downward pressure on prices is being registered in inner London areas where prices are highest prices, yields lowest and with a greater share of discretionary buyers. Subscribers to the Cities Index mailing list can see a full breakdown of house price growth across London by local authority where there are fifteen markets registering negative growth.
No signs of price weakness in large regional cities
The latest results confirm our view that house prices in London are set to drift lower in the next 2-3 years. In contrast, house price growth remains robust in the largest regional cities where similar analysis on rising and falling markets reveals no evidence of localised price falls.
Fig.3 – % London postcodes with +ve or -ve growthx
Source: Hometrack House Price Indices